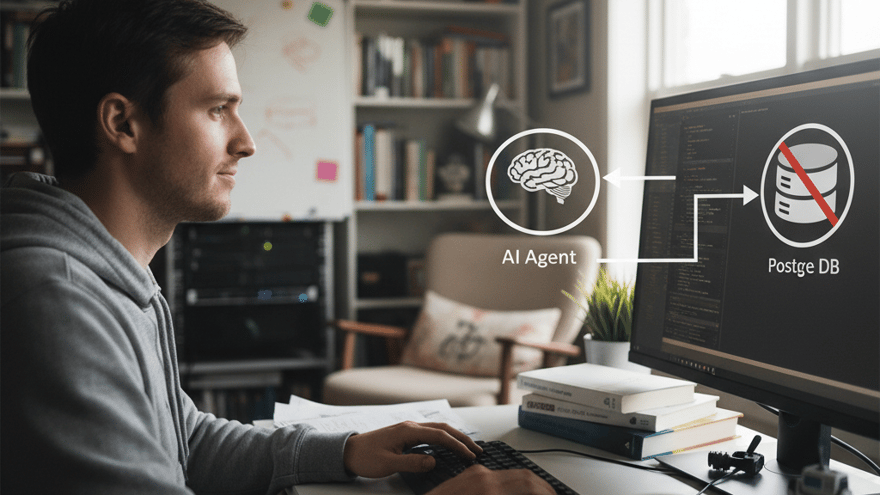
Seu agente IA em produção é black box (invisível, falha silent)
Agente IA em SageMaker é invisível (sem observabilidade). Falha silenciosamente. Customers sofrem. ROI desaparece.

Equipe OpenClaw · Time de Engenharia & Produto
A Equipe OpenClaw é formada por engenheiros, designers e especialistas em IA dedicados a construir a melhor plataforma de agentes conversacionais para negócios brasileiros. Combinamos expertise…
Seu agente IA em produção é black box (invisível, falha silent)
Você tem SaaS.
Seu SaaS: agente IA no WhatsApp (atendimento ao cliente).
Você deployou agente em produção (AWS SageMaker):
"Agora agente está rodando 24/7.
Agente vai atender customers (no WhatsApp).
Agente vai resolver problemas (no automaticamente).
ROI vai crescer (customers atendidos, custo reduzido).
Tudo vai ser ótimo."
Você go live (agente deployed).
First week: Everything seems fine.
Second week: You get first complaint.
Customer says:
"Your agente gave me wrong answer.
I asked about refund policy.
Agente said: 'You can't refund after 30 days.'
But your actual policy is: 'You can refund within 90 days.'
Your agente lied to me.
Now I'm upset."
You respond:
"Oh no. I'm sorry.
Let me check why agente gave wrong answer."
But here's the problem:
You have NO VISIBILITY into agente.
You don't know:
- How many customers asked this question?
- How many times did agente give wrong answer?
- When did agente start failing?
- Is agente still failing right now?
- What's the quality of agente outputs?
- Is GPU saturated (agente slow)?
- What's the latency (how long does agente take to respond)?
- Is agente costing more than expected?
You're flying blind.
Your agente is a BLACK BOX.
Recent news (May 2026):
"AWS releases: Comprehensive observability for LLM inference on SageMaker
"Problem: LLMs in production are hard to monitor (outputs are non-deterministic).
"Solution: Observe GPU usage, LLM quality, latency, cost.
"Without observability: LLM failures are silent (customers suffer, you don't know)."
You realize:
"Oh no.
I should have observability.
Without observability, agente is invisible.
Agente is failing, but I don't see it.
Customers are suffering.
My ROI is collapsing.
I need observability NOW."
O problema (agente IA sem observabilidade)
Why LLM observability is hard (not like traditional software)
TRADITIONAL SOFTWARE OBSERVABILITY:
Example: Payment API
-
Request comes in Input: {amount: 100, currency: "BRL", customer_id: 123}
-
API processes Logic: validate amount, check balance, transfer money
-
Response comes out Output: {success: true, transaction_id: "TX123", status: "completed"}
-
Observability is easy
- Did request come in? Yes (log says so)
- Did API respond? Yes (response says so)
- Was it successful? Yes (status = "completed")
- Was it fast? Yes (latency = 50ms)
- Did it cost money? Yes (cost = R$ 0.10)
Why easy? Output is DETERMINISTIC (same input → same output) Validation: Easy (status field tells you success/failure)
LLM SOFTWARE OBSERVABILITY:
Example: Agente IA (refund policy question)
-
Request comes in Input: "What's your refund policy?"
-
LLM processes Logic: Generate response (using neural network)
-
Response comes out Output: "You can't refund after 30 days." ← WRONG (Or "You can refund within 90 days." ← RIGHT) (Or "Refund policies vary." ← VAGUE)
-
Observability is HARD
- Did request come in? Yes
- Did LLM respond? Yes
- Was it successful? ??? (How do you know?)
- Was output correct? ??? (No status field)
- Was it fast? Maybe (latency = 200ms, but is that normal?)
- Did it cost money? Yes (cost = R$ 0.02, but is that right?)
Why hard? Output is NON-DETERMINISTIC (same input → different outputs possible) Validation: Hard (no status field, need to evaluate quality manually)
WHAT'S DIFFERENT:
Traditional software:
- Output: Deterministic (if input X, always output Y)
- Validation: Simple (check status code, check field value)
- Quality metric: Straightforward (success/failure)
LLM software:
- Output: Non-deterministic (if input X, might output Y, Z, or W)
- Validation: Complex (need to evaluate output semantically)
- Quality metric: Unclear (success = what? correct answer? helpful? relevant?)
RESULT:
Traditional software: Easy to monitor (is it working? Yes/No) LLM software: Hard to monitor (is it working? ??? - unclear)
Without observability: LLM failures are INVISIBLE
Silent failures in production (the nightmare scenario)
SCENARIO: Your agente IA is failing (silently)
Week 1: Agente deployed
- LLM quality: Good (accuracy = 95%)
- GPU usage: Normal (50% utilization)
- Latency: Fast (150ms per request)
- Cost: Expected (R$ 0.02 per request)
- ROI: Positive (agente is profitable)
Week 2: LLM quality degrades (silently)
- Reason: Input distribution changed (customers asking different questions)
- LLM accuracy: Dropped to 80% (agente gives wrong answers more often)
- But you don't know (no monitoring)
- GPU usage: Still normal (no alert)
- Latency: Still fast (no alert)
- Cost: Still expected (no alert)
- Customers: Starting to complain (but you don't see pattern)
- ROI: Already declining (but you don't know)
Week 3: More complaints
- Customers: "Agente keeps giving wrong answers"
- You: "What? But everything looks fine in my logs"
- Reality: Agente quality is terrible (40% accuracy)
- You: Blind to the problem (no observability)
- Customers: Frustrated (agente is useless)
- ROI: Negative (agente is costing money, not saving it)
Week 4: Crisis mode
- You finally notice: Support tickets increased 300%
- You finally investigate: Agente quality is terrible
- You finally fix: Retrain LLM, tune prompts, etc
- But damage is done: Customers already left
- Cost: R$ 50k in support tickets + customer churn
WHAT WENT WRONG:
No observability = No visibility = Silent failure = Crisis
If you HAD observability:
- Week 2: Alert fires (LLM quality dropped from 95% to 80%)
- Week 2: You investigate (input distribution changed)
- Week 2: You fix (adjust prompts, retrain)
- Week 3: Crisis averted (no customer damage)
THE COST OF SILENT FAILURE:
Without observability:
- Silent failures = huge damage (customers suffer, you don't know)
- Crisis response = expensive (emergency fixes, support burden)
- Customer churn = permanent (lost revenue, reputation damage)
- Total cost: R$ 50k+ in hidden costs
With observability:
- Early detection = quick fix (problem caught early)
- Minimal damage = small impact (few customers affected)
- No churn = sustainable revenue (customers happy)
- Total cost: R$ 5k in monitoring tools + R$ 10k in proactive fixes
Savings: R$ 35k+ (plus reputation, customer retention, etc)
What you should be monitoring (observability checklist)
OBSERVABILITY DIMENSIONS:
-
LLM Quality ("Is agente outputting correct answers?") Metrics:
- Accuracy: % of correct answers (target: >95%)
- Relevance: Are answers relevant to question? (target: >90%)
- Hallucination rate: % of made-up facts (target: <5%)
- Toxicity: % of toxic/offensive outputs (target: 0%)
How to measure:
- Human evaluation (have humans rate sample outputs)
- Automated evaluation (use another LLM to judge quality)
- Customer feedback (track complaint rates)
- Semantic similarity (compare output to expected answer)
Alert threshold:
- Quality drops >10%: ALERT (something is wrong)
- Quality drops >20%: CRITICAL (fix immediately)
-
GPU Utilization ("Is infrastructure overloaded?") Metrics:
- GPU utilization: % of GPU used (target: 60-80%)
- GPU memory: % of GPU RAM used (target: 70-85%)
- Queue length: How many requests are waiting (target: <10)
- GPU temperature: Thermal condition (target: <80°C)
Alert threshold:
- GPU >90%: ALERT (might be bottleneck)
- GPU >95%: CRITICAL (scale up, or requests timeout)
- Queue >50: ALERT (customers experiencing delays)
-
Latency ("How fast is agente responding?") Metrics:
- P50 latency: 50th percentile (median response time)
- P95 latency: 95th percentile (slow responses)
- P99 latency: 99th percentile (very slow responses)
- Mean latency: Average response time
Example:
- P50: 150ms (typical customer waits 150ms)
- P95: 500ms (slow customers wait 500ms)
- P99: 2000ms (very slow customers wait 2 seconds)
Alert threshold:
- P95 > 1000ms: ALERT (customers might timeout)
- P99 > 5000ms: CRITICAL (fix immediately)
-
Cost ("Is agente costing what I expected?") Metrics:
- Cost per request: How much does each LLM call cost?
- Cost per customer: Total cost to serve one customer
- Daily cost: How much are we spending per day?
- Cost trend: Is cost increasing or decreasing?
Example:
- Cost per request: R$ 0.02 (expected)
- Daily cost: R$ 100 (1.000 requests × R$ 0.02 × 5 customers)
- Cost trend: +30% (something is wrong, costs increasing)
Alert threshold:
- Cost per request +50%: ALERT (something inefficient)
- Cost per request +100%: CRITICAL (fix immediately)
-
Error Rate ("Is agente failing?") Metrics:
- API errors: % of requests that fail (target: <0.5%)
- Timeout errors: % of requests that timeout (target: <1%)
- Invalid outputs: % of outputs that don't make sense (target: <2%)
- Customer complaints: # of support tickets (target: <1 per day)
Alert threshold:
- Error rate >5%: ALERT
- Error rate >10%: CRITICAL
HOW TO IMPLEMENT OBSERVABILITY:
-
Instrument agente code (add monitoring) python import time from prometheus_client import Counter, Histogram
Metrics
llm_requests = Counter('llm_requests_total', 'Total LLM requests') llm_quality = Histogram('llm_quality_score', 'LLM output quality') llm_latency = Histogram('llm_latency_ms', 'LLM response latency') llm_cost = Histogram('llm_cost_usd', 'LLM request cost')
def agente_process_message(user_message): start = time.time() llm_requests.inc()
# Call LLM response = llm.generate(user_message, max_tokens=100) # Record latency latency = (time.time() - start) * 1000 llm_latency.observe(latency) # Record quality (manual or automated eval) quality = evaluate_quality(response) llm_quality.observe(quality) # Record cost cost = response.usage.cost llm_cost.observe(cost) return response -
Set up monitoring dashboard (visualize metrics)
- Use Datadog, New Relic, or Prometheus + Grafana
- Create dashboard with 5 main metrics
- Update every 5-10 minutes (real-time view)
-
Set up alerts (notify on problems)
- Alert: LLM quality drops >10%
- Alert: GPU utilization >90%
- Alert: P95 latency >1000ms
- Alert: Cost per request +50%
- Alert: Error rate >5%
-
Implement remediation (auto-fix or manual)
- Auto-remediate: Scale GPU if utilization >90%
- Manual remediate: Retrain LLM if quality drops
- Manual remediate: Adjust prompts if errors increase
A solução (observabilidade LLM em SageMaker)
AWS SageMaker observability tools (what's available)
AWS NATIVE TOOLS:
-
CloudWatch (basic monitoring)
- GPU utilization, memory, temperature
- Request count, error rate, latency
- Cost tracking
- Setup: 2 hours (connect SageMaker → CloudWatch)
- Cost: R$ 50/month (included in AWS)
-
SageMaker Model Monitor (LLM quality)
- Drift detection (quality declining?)
- Data quality checks
- Bias detection
- Setup: 4 hours (define quality metrics)
- Cost: R$ 200/month
-
X-Ray (distributed tracing)
- Trace agente through system (request → LLM → database → response)
- Identify bottlenecks
- Debug latency issues
- Setup: 2 hours
- Cost: R$ 100/month
THIRD-PARTY TOOLS:
-
Datadog (comprehensive monitoring)
- All metrics (GPU, latency, quality, cost, errors)
- Real-time dashboard
- Alerts
- Setup: 4 hours (connect SageMaker → Datadog)
- Cost: R$ 1.000-2.000/month
-
New Relic (APM + monitoring)
- Application performance monitoring
- LLM-specific insights
- Setup: 3 hours
- Cost: R$ 800-1.500/month
-
Arize AI (LLM monitoring specialized)
- Purpose-built for LLMs
- Quality monitoring, drift detection
- Setup: 2 hours
- Cost: R$ 500-1.000/month
RECOMMENDATION:
Start with: CloudWatch (free) + manual quality checks (daily evaluation) Grow to: CloudWatch + SageMaker Model Monitor (quality automated) Scale to: Datadog or Arize (comprehensive observability)
Timeline: Start now (don't wait for agente to fail) Cost: R$ 50-200/month initially (worth it vs R$ 50k silent failure risk)
Observability best practices (setup guide)
STEP 1: DEFINE SUCCESS METRICS (Week 1)
What does "agente working well" mean?
- LLM quality >95% (accuracy metric)
- Response time <500ms (latency metric)
- Error rate <1% (reliability metric)
- Cost <R$ 0.05 per request (cost metric)
- GPU utilization 60-80% (efficiency metric)
Document these (share with team)
STEP 2: INSTRUMENT CODE (Week 1-2)
Add monitoring code:
- Log every LLM request (timestamp, input, output)
- Log latency (how long did LLM take?)
- Log cost (how much did it cost?)
- Log quality score (is output good?)
Use framework:
- Python: prometheus_client, structlog
- Node.js: prom-client, winston
STEP 3: SET UP DASHBOARD (Week 2-3)
Create visual dashboard:
- Metric 1: LLM quality (accuracy) - big number, color-coded
- Metric 2: Latency (P50, P95, P99) - line chart over time
- Metric 3: Error rate - % trending
- Metric 4: Cost - $ trending
- Metric 5: GPU utilization - % trending
Update: Every 5-10 minutes (near real-time)
STEP 4: SET UP ALERTS (Week 3)
Create alerts:
- Alert: LLM quality drops >10% (email + Slack)
- Alert: Latency P95 >1000ms (email + Slack)
- Alert: Error rate >5% (email + Slack)
- Alert: Cost per request +50% (email + Slack)
- Alert: GPU >90% (email + Slack)
Responses:
- Alert → Team gets notified → Team investigates → Team fixes
- Timeline: <1 hour from alert to investigation
STEP 5: ESTABLISH RUNBOOKS (Week 4)
For each alert, document:
- What does alert mean?
- What could be wrong?
- How do I fix it?
Example: Alert: "LLM quality dropped 15%" Meaning: Agente accuracy went from 95% to 80% Causes: (a) Input distribution changed, (b) Model degraded, (c) Prompt became stale Fixes: (a) Retrain on new data, (b) Rollback to previous model, (c) Update prompt
STEP 6: CONTINUOUS IMPROVEMENT (Week 5+)
Weekly review:
- Check dashboard: Are metrics trending up or down?
- Review alerts: What alerts fired? Why?
- Analyze customers: Are customers complaining?
- Improve: What can we do better?
Monthly review:
- Report to leadership: Here's agente health
- Compare to target: Are we meeting SLAs?
- Plan improvements: What should we invest in?
Conclusão: Seu agente IA precisa de observabilidade (não é opcional)
**O que você precisa saber:
-
LLM observability is different from traditional software
- Traditional software: Deterministic (same input → same output)
- LLM software: Non-deterministic (same input → different outputs)
- Traditional monitoring: Simple (status field tells you success/failure)
- LLM monitoring: Complex (need to evaluate output quality manually/automatically)
-
Without observability, agente failures are SILENT
- Agente quality degrades (but you don't know)
- Customers suffer (but you don't see it)
- ROI collapses (but it looks fine in dashboards)
- Crisis happens (suddenly 300% more support tickets)
- Damage: R$ 50k+ (customer churn, emergency fixes, reputation)
-
What you MUST monitor (5 dimensions)
- LLM Quality: Accuracy, hallucination rate, toxicity (target: >95%)
- GPU Utilization: GPU %, memory %, queue length (target: 60-80%)
- Latency: P50, P95, P99 response times (target: <500ms P95)
- Cost: Cost per request, daily cost trend (target: <R$ 0.05/req)
- Error Rate: API errors, timeouts, invalid outputs (target: <1%)
-
How to implement (5 steps)
- Step 1: Define success metrics (what does "working well" mean?)
- Step 2: Instrument code (add logging, metrics)
- Step 3: Set up dashboard (visualize metrics in real-time)
- Step 4: Set up alerts (notify when metrics drift)
- Step 5: Establish runbooks (how to respond to alerts)
-
Tools to use (pick one path)
- Path 1: CloudWatch (AWS native, free/cheap, basic)
- Path 2: Datadog (comprehensive, expensive, best-in-class)
- Path 3: Arize AI (LLM-specialized, moderate cost, purpose-built)
Na OpenClaw, ajudamos agentes IA a:
- DEFINE success metrics (what is agente health?)
- IMPLEMENT observability (monitoring + dashboards + alerts)
- MONITOR LLM quality (accuracy, hallucination, cost, latency)
- RESPOND to alerts (runbooks, auto-remediation, manual fixes)
- SCALE agente confidently (you can see what's happening)
Resultado: Seu agente IA é VISIBLE (você vê tudo: quality, latency, cost, GPU) + RELIABLE (early detection of failures) + PROFITABLE (ROI protected, no silent failures) + SCALABLE (you understand bottlenecks, can optimize).
Seu agente IA é black box (invisível, falha silent)?
Ou seu agente IA é observável (visible, you catch problems early)?
Publicado em 30 de maio de 2026